Introduction
A diffraction grating is used to separate polychromatic light into its constituent wavelengths. In a Raman spectrometer diffraction gratings are used to separate the constituent wavelengths of the collected Raman scatter onto different pixels of the CCD camera for detection. All Raman spectrometers will require at least one diffraction grating and will frequently be configured to contain more than one to allow the user optimum grating selection for their samples and excitation wavelength(s).
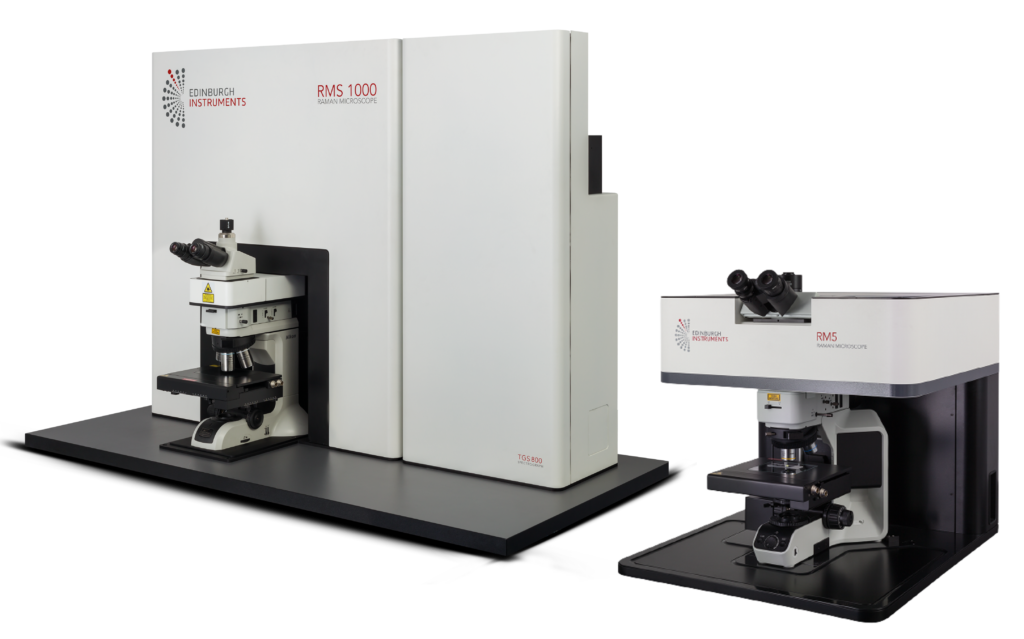
Figure 1: Edinburgh Instruments RMS1000 (left) and RM5 (right) Raman Microscopes
When analysing samples by Raman spectroscopy multiple excitation sources may be required to cover the users range of samples, for example, lasers in the UV, visible, or NIR regions. The RM5 Raman Microscope can host up to three lasers, and the RMS1000 Raman Microscope up to five with the option of additional external lasers. To operate with multiple laser lines the spectrographs of the RM5 and RMS1000 can host up to five diffraction gratings so that a grating best suited for the laser’s wavelength and the users’ requirements. The gratings can be selected by the user from a drop-down menu in the Ramacle® software, Figure 2, on the RM5 and RMS1000. After selection, the grating turret will automatically move to the selected grating meaning there is no need for the user to manually exchange gratings. Ramacle® will then display the spectral range achievable with this grating and excitation laser both in wavenumber and wavelength. When selecting a diffraction grating for a Raman spectrometer there are four main considerations: spectral resolution, spectral range, blaze wavelength, and excitation wavelength.
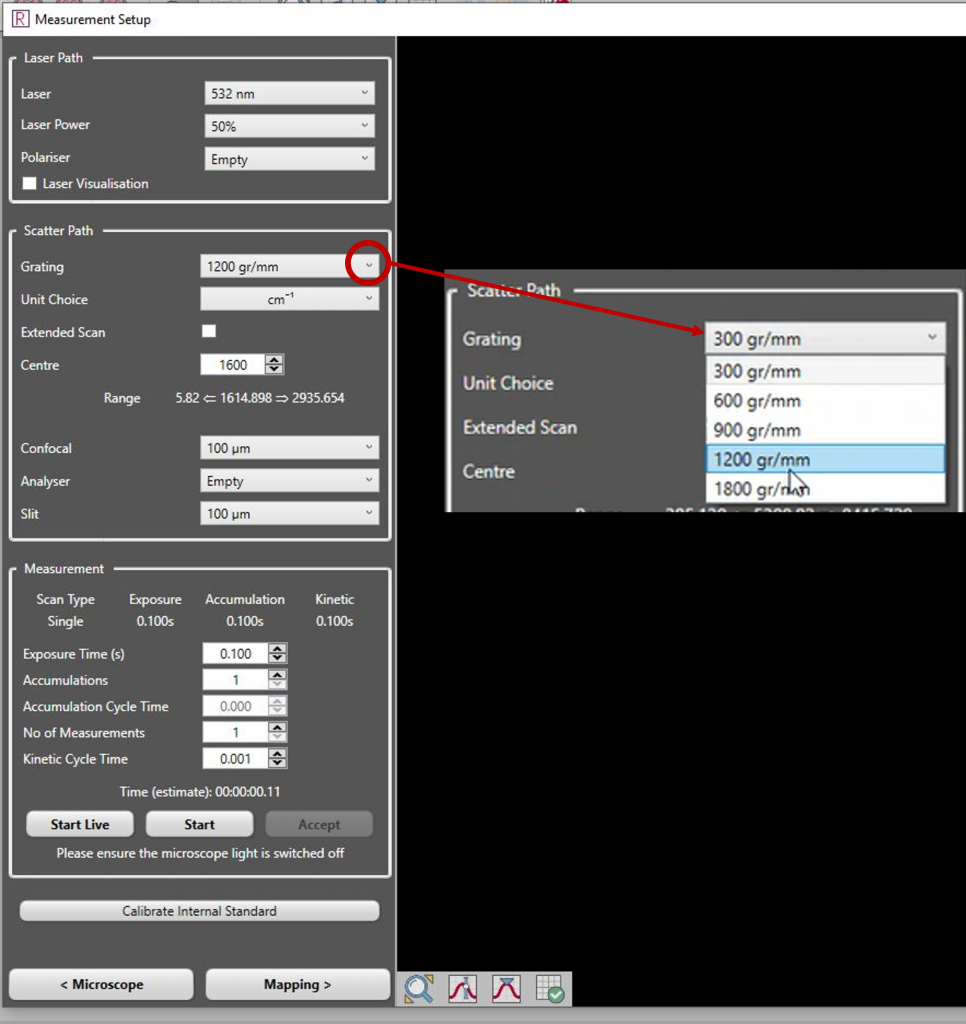
Figure 2: Ramacle® software in measurement set up, highlighting ease of grating selection.
Spectral Resolution

Gratings have a defined groove density (measured in grooves per millimetre, gr/mm), which controls the dispersion of light. The higher the groove density, the better the spectral resolution, for example, a 1200 gr/mm grating will provide higher spectral resolution than a 150 gr/mm grating. The dispersion of light by a low and high groove density grating is illustrated in Figure 3. The higher groove density grating spreads the light over a larger area of the CCD; increasing the spectral resolution. The simple rule of thumb is when the number of grooves is doubled, the resolution is roughly doubled.
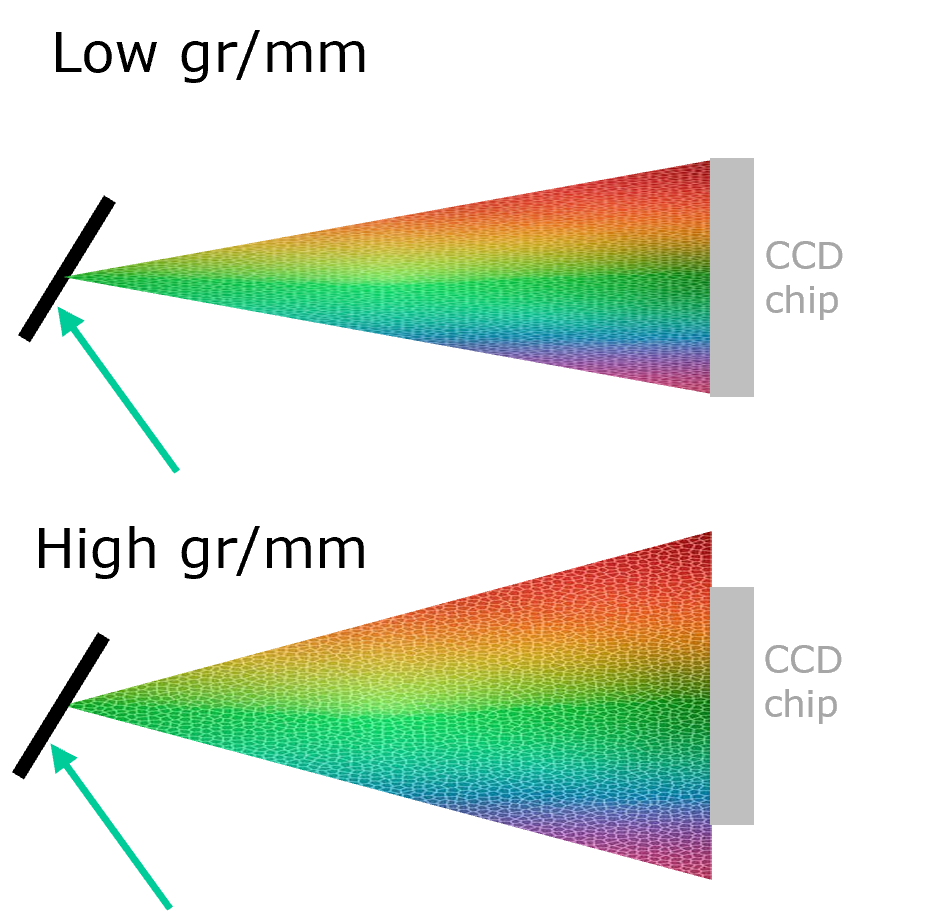
Figure 3: Dispersion of light by a low and high groove density grating.
To illustrate the effect of groove density on spectral resolution, the spectrum of MoS2 on a silicon substrate was measured (Figure 4) using five diffraction gratings, and a 532 nm excitation wavelength. The analysis of MoS2 focuses on the two peaks between 350-450 cm-1. These peaks are critical for detecting the number of layers of MoS2 present. Using a 300 gr/mm grating, the spectral resolution is insufficient to resolve the two individual peaks and a single broad feature is seen. As the gr/mm increases we see the improved resolution of the two individual peaks. The better the resolution of these two peaks the more accurate the information on peak position and number of layers. This measurement exemplifies the importance of spectral resolution.
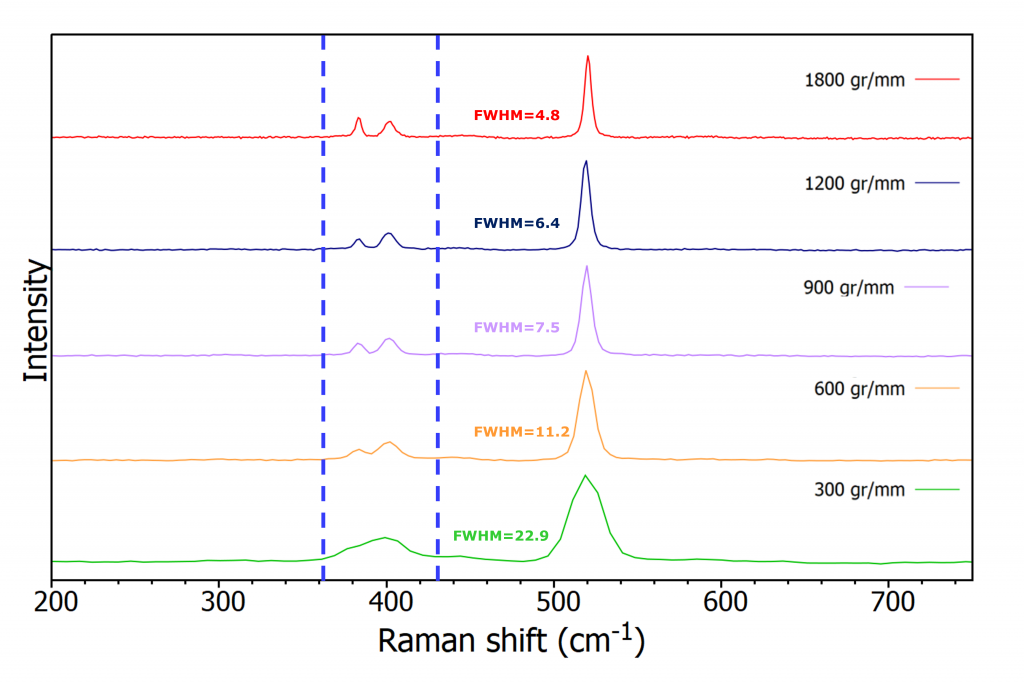
Figure 4: Raman spectrum of MoS2 acquired using five different gratings.
Figure 4 also shows the full width half maximum (FWHM) values of the silicon peak from the sample. Ramacle® can provide FWHM values (the width of the peak at half its maximum intensity) and display these on the spectra. Starting with the 300 gr/mm grating, we observe a FWHM of 22.9 cm-1. This value decreases to 4.8 cm-1 when using an 1800 gr/mm grating, highlighting the improvement in spectral resolution with increasing groove density.
Spectral Range

Changing the groove density of the grating affects the spectral resolution as discussed, but it will also impact the spectral range. A sample of cyclohexane was placed in a cuvette holder for analysis with 638 nm excitation using all five gratings (Figure 5). The spectra again show how the resolution increases with increasing groove density, but now also demonstrate the downside of high groove density; reduced spectral range. The spectral range of the spectrometer is inversely proportional to the groove density of the grating.
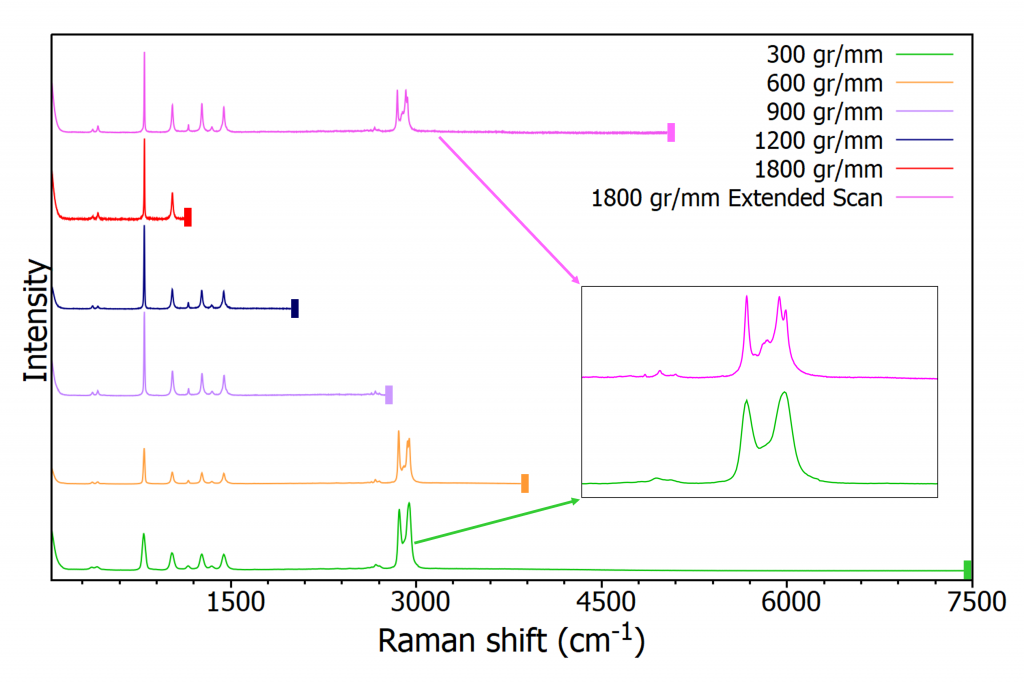
Figure 5: Raman spectra of cyclohexane with different gratings and extended scan with an 1800 gr/mm grating (magenta). Insert shows the high wavenumber region of the sample with 300 gr/mm and 1800 gr/mm grating.
The spectra above clearly show the decrease in spectral range as the groove density is increased. With the 300 gr/mm the spectral range goes to ~7400 cm-1, whilst the 1800 gr/mm grating only reaches approx. ~1100 cm-1. Hence, there is an inherent trade-off between the spectral range of the Raman spectrum that is captured, and the resolution of that capture.
In order to get the best of both worlds, the Ramacle® software of the RM5 and RMS1000 has a feature called Extended Scan. In an Extended Scan the Ramacle® software acquires a series of spectra at different centre wavelength positions of the diffraction grating and these are then automatically stitched together to give a single Raman spectrum over a wide spectral range. This feature enables the user to use a high gr/mm grating for high spectral resolution and broad spectral range simultaneously. Figure 5 shows an example of a stitched 1800 gr/mm spectrum (magenta) with a range up to ~5000 cm-1.
The downside of an extended scan is the increase in acquisition time. As the grating needs to move and multiple spectra acquired, the acquisition time will be increased, for the example above (0-5000 cm-1) the extended scan is nine single spectra stitched together. Therefore, if the exposure time is one second, the final spectrum will take nine seconds to acquire. As shown in the insert in Figure 5, the increased spectral resolution of the 1800 gr/mm grating enables better resolution of the peaks in the high wavenumber region, whilst the lower resolution 300 gr/mm grating enables faster measurement.
Blaze Wavelength

The efficiency of diffraction gratings is always wavelength-dependent. The wavelength of maximum diffraction efficiency is called the blaze wavelength. Diffraction gratings can be manufactured with different blaze wavelengths to optimise different wavelength regions. Typically, visible and NIR lasers can use gratings with the same blaze wavelength whilst keeping similar efficiency; however, when using lasers at the extremes of “standard” Raman lasers e.g., ≤325 nm and ≥1064 nm excitation, different blaze wavelength gratings are required to optimise the spectrometer. For example, when a grating is stated “Blaze 300 nm” it is optimised for the UV, whilst “Blaze 750 nm” will be optimised for the NIR.
Figure 6 shows the absolute efficiency curves for two 600 gr/mm gratings. One has a blaze wavelength of 550 nm, ideal for visible lasers, and the other 750 nm, optimised for NIR lasers. The curves reveal why blaze wavelength is important. If exciting with the commonly used 785 nm laser the 550 nm blazed grating would only have an efficiency of about 52%. The NIR optimised grating however would have a much higher efficiency of about 71%. This will have a significant impact on the spectral quality and acquisition times required.
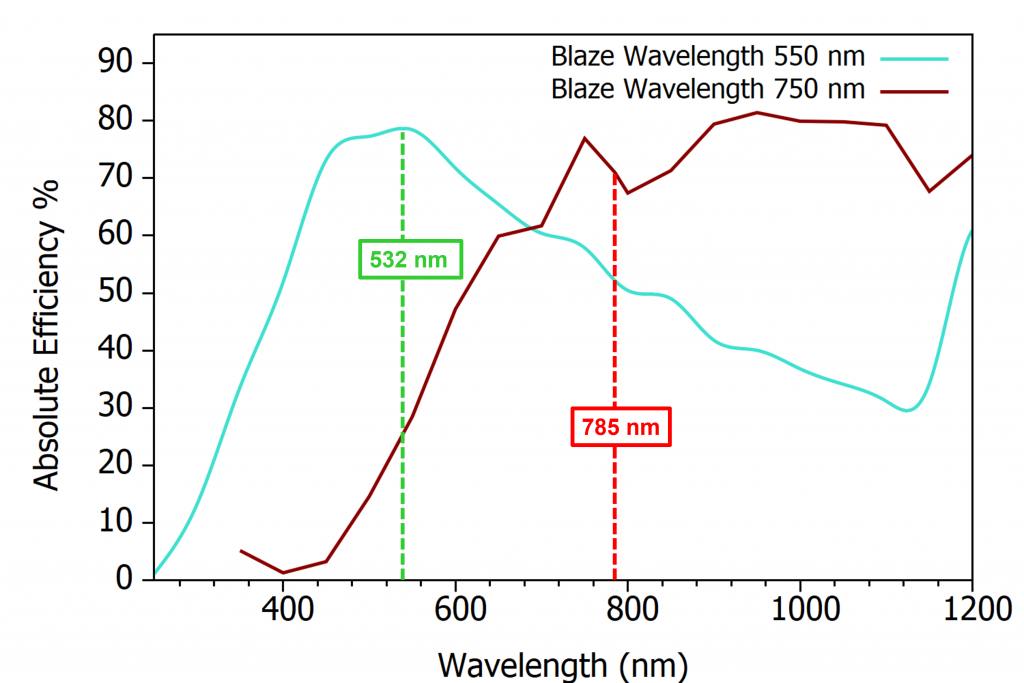
Figure 6: Absolute efficiency curves of two 600 gr/mm gratins with blaze wavelengths 550 nm and 750 nm with two common laser lines highlighted (532 nm and 785 nm).
Photoluminescence Measurements

Raman microscopes can also be used to measure photoluminescence (PL), typically using a UV or visible excitation. PL emission is typically very broad and low groove density gratings should be selected for the widest possible spectral range. In the example shown in Figure 7, pen ink was analysed using a 532 nm laser. By using a 300 gr/mm grating, the spectral range covers up to 1200 nm, meaning the user can easily see the PL peak at 700 nm.
Since the PL is extremely strong, when using a 300 gr/mm grating, any Raman peaks are lost to the intensity of the PL peak. The Raman spectrum can still be observed, however, by changing to an 1800 gr/mm grating. In doing so the Raman peaks from the ink can be resolved without PL interference since it occurs before the PL peak or detector saturation. Using a combination of gratings in this way allows for both PL and Raman spectra to be obtained from a sample.
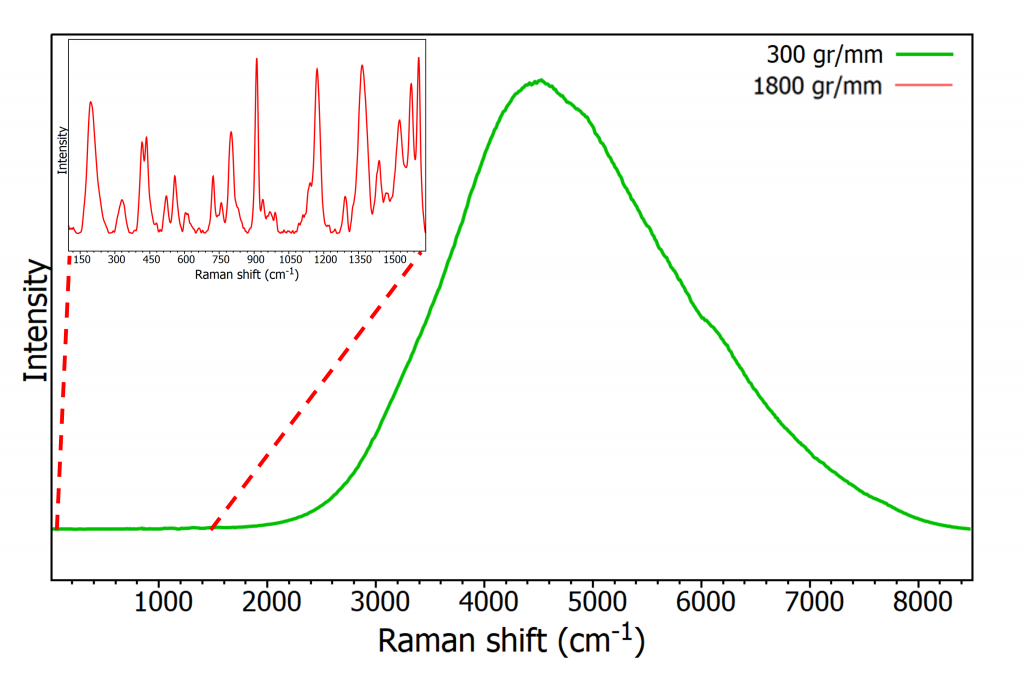
Figure 7: PL and Raman spectrum of pen ink using a 300 gr/mm (green) and 1800 gr/mm grating (red).
Excitation Wavelength


The dispersion power of a grating can be considered constant in terms of wavelength; however, Raman spectra use the energy related unit, wavenumbers (cm-1), which represents the shift in energy from the incident photon. This means the spectral resolution decreases in a dispersive Raman spectrometer as the laser excitation wavelength decreases (i.e., from red to green to blue). Thus, when using a 785 nm laser the grating required to achieve the same resolution as a 532 nm laser will need fewer gr/mm.
Additionally, there is a working range over which a grating can successfully operate, as dispersion is wavelength dependent. The theoretical wavelength limit for a grating with a groove density of n is λ=2/n. For example, a 2400 gr/mm grating will be limited to the green end of the spectrum i.e., visible and UV lasers, and a 3600 gr/mm not diffracting much after 500 nm, making it suited to UV excitation, and not suitable for NIR excitation.
Figure 8 shows the spectral range of a 532 nm (green) and 785 nm laser (red) for five commonly used gratings. The reduction in spectral range for the NIR laser compared to the visible option is evident. The figure also shows the range one can see for both a single scan, starting at 50 cm-1, and the extended scan option.
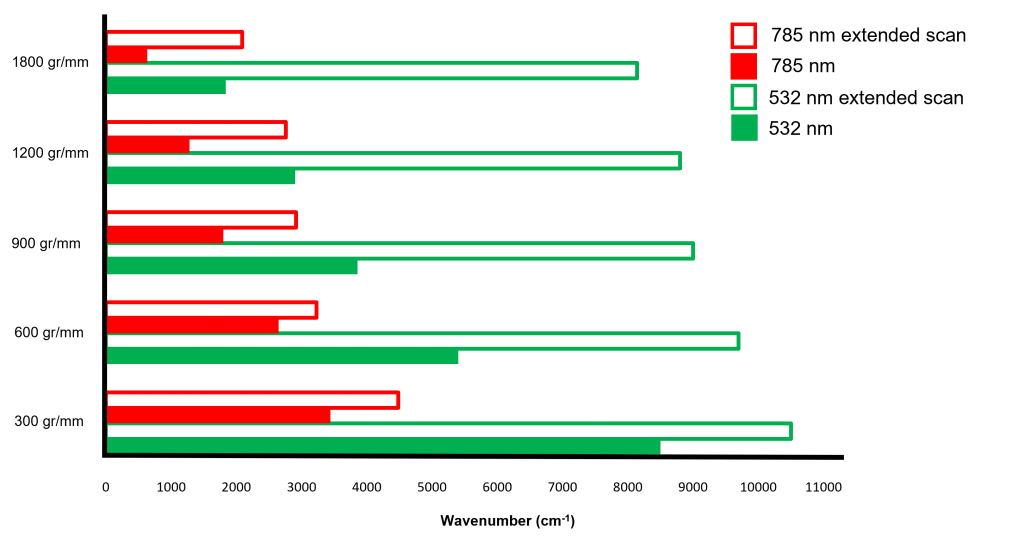
Figure 8: Spectral range for five gratings with 532 nm and 785 nm excitation.
The three lasers used in Raman spectroscopy can be broadly split up into three regions: UV, visible, and NIR. For UV lasers high groove density gratings are recommended, such as 2400 gr/mm and 3600 gr/mm, mainly due to the inherent decrease in spectral resolution when exciting at lower wavelength. Additionally, UV lasers are typically used to study small peak changes due to stress and strain for example, in semiconductor samples, and high spectral resolution is therefore required.
Visible lasers will typically be used with 1200 gr/mm and 1800 gr/mm gratings when requiring medium and high spectral resolution. However, some samples such as transition metal dichalcogenides and graphene may use a higher groove density grating to detect the subtle spectral changes. For both UV and visible lasers, if the user is interested in PL lower groove density gratings can be used to acquire the entire spectrum, e.g., 300 gr/mm and 600 gr/mm.
For a NIR laser the recommended gratings will have a low groove density, e.g., 300 gr/mm and 600 gr/mm. Firstly this is for spectral range, as seen in Figure 8 the range offered by high groove density gratings with NIR lasers is extremely limited. Additionally, as discussed above, NIR lasers will inherently offer better spectral resolution than a UV or visible laser. This means using a NIR laser with a low groove density grating will still provide high spectral resolution.
A final point to consider concerning NIR lasers is Raman intensity and signal to noise ratio (SNR). As the groove density increases, the Raman throughput of the instrument will decrease. This effect occurs for all excitation wavelengths; however, this effect is particularly noticeable for NIR lasers. Raman scattering intensity is proportional to λ-4, where λ represents the laser wavelength. Therefore, as the laser wavelength is increased into the NIR, the Raman intensity will fall. The compounding of the grating effect and the wavelength effect means that working with a high groove density grating in the NIR is particularly detrimental to signal-to-noise (SNR) and spectra will require long exposure times. The spectra in Figure 9 are from a pharmaceutical tablet using a 785 nm laser and two gratings of the same blaze wavelength. The SNR difference between the two gratings is highlighted in the red box of Figure 9 (after normalisation). In this case, the 300 gr/mm clearly offers a higher SNR.
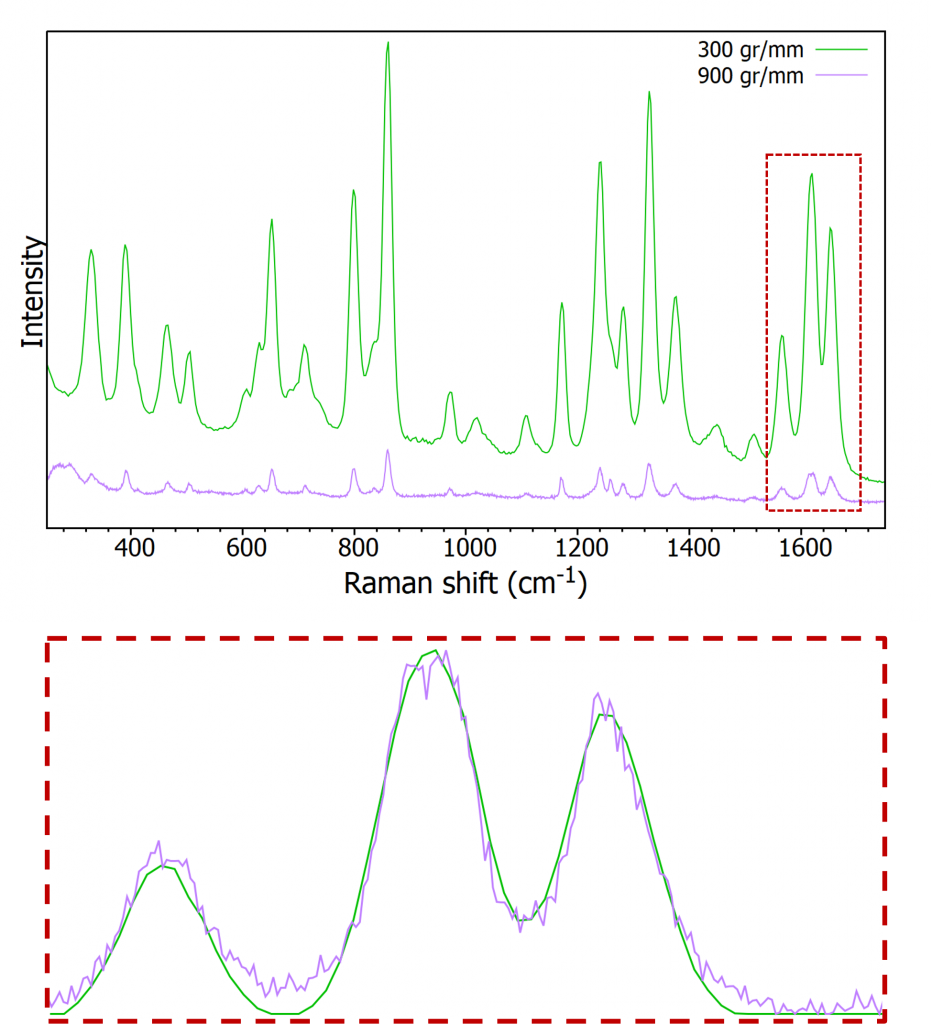
Figure 9: Top – Raman spectrum of a pharmaceutical tablet with identical exposure time and two different gratings. Bottom – zoomed section of the normalised spectra showing increased noise using a 900 gr/mm grating.
Table 1 shows a simplified summary of grating selection for the two most commonly used excitation wavelengths in Raman spectroscopy; 532 nm and 785 nm. Note these spectral ranges are for extended scans, and final grating selection will also be impacted by the factors discussed previously.
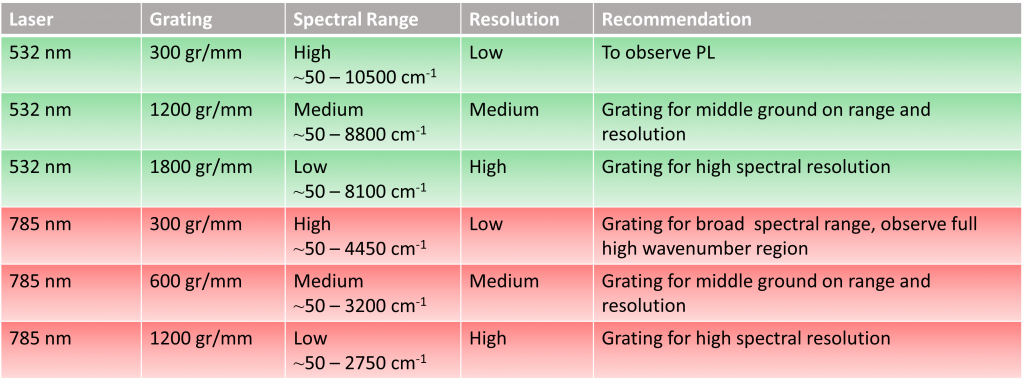
Table 1: Grating selection for a 532 nm and 785 nm excitation
Conclusion
Selecting a grating in Raman spectroscopy requires a choice from the user on what to prioritise. Ensuring gratings are blazed at the correct wavelength for the excitation laser will give the highest possible efficiency. Choosing the necessary groove density for measurements will depend on the spectral resolution and spectral range required. Additional factors such as Raman intensity, acquisition time, and signal-to-noise ratio will also need to be considered when selecting a grating. Edinburgh Instruments Raman Microscopes can host up to five gratings making it easy for the user to populate their system with a range of groove density and blaze angles to suit their application needs, offering the highest possible flexibility when analysing samples.