Channels
Special Offers & Promotions
Detecting a Mouse Pancreatic Cancer Cell Line Using iBox Explorer Imaging Microscope
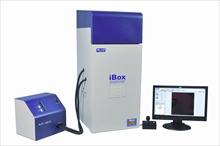 In vivo imaging of small animals for
pre-clinical research using fluorescent markers is a novel approach to
visualize cellular processes occurring at the micron level. There is growing
interest in understanding what occurs at the level of tumor metastasis through
direct visualization. For example, studies show that it is possible to use
green fluorescent protein (GFP) and red fluorescent protein (RFP) labeled tumor
cells to observe their behavior in the vasculature in vivo, such as tumor
shedding and extravagation[i]. The iBox Explorer Imaging Microscope, for
visualization of the tumor microenvironment both accurately and reliably, will
expand the understanding of the mechanism of metastasis. The ability to view
fluorescence ranging from the organ level down to the cellular level can add
valuable information of in vivo processes.
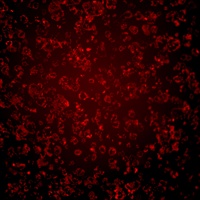
 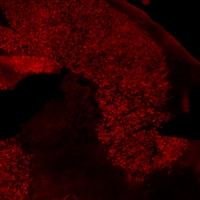 In a study, a pancreatic tumor tissue
sample was imaged at two magnifications: 2.5x and 8.8x. A red fluorescent
protein (RFP) filter highlights the RFP-tagged cytoplasm and observes the
distinct morphologic characteristics of individual cells as well as tissue
microenvironment ex vivo. Use of the iBox Explorer can aid in the visualization
of many cellular processes through fluorescence technology. Visualization can
occur across a wide range of magnifications and spanning the visible to near
infrared spectrum.
 XPA1 dual-color mouse pancreatic cancer cell line (AntiCancer, Inc.) was grown orthotopically, surgically resected, sectioned with a microtome at a 20-micron thickness, and transferred to a slide for imaging. Two tissue slices were selected from the center of the bulk tumor and placed side by side. The sample was then stored in a -20°C freezer until it was ready for imaging.
 BioLiteTM Xe MultiSpectral Light Source
(UVP, LLC), part of the iBox Explorer, provides luminous excitation with a high
level of intensity. For excitation of RFP flurophore, a filter (peak wavelength
525nm and bandpass 502-547nm) was used. A darkroom emission filter (peak
wavelength 605nm and bandpass of 580-630nm) highlights the RFP-labeled
cytoplasm. Images were captured using the iBox Explorer. Illumination was
directed coaxially and via side-lighting through the iBox Explorer's optics. Captured
images were edited with the background fluorescence removed using histogram
adjustment. Images were pseudo-colored according to filtration specifications
(RFP/GFP).
 Figure 1 shows 2.5x magnification of an illuminated specimen. Cellular orientation, tissue architecture and cytoplasmic morphology can be clearly delineated using an RFP emission filter. Further magnification (8.8x) of the same sample (Figure 2) reveals more details of cytoplasmic structure, specifically areas of high concentration of RFP in addition to cytoplasmic extensions and cellular orientation.
This application illustrates the iBox Explorer for imaging fluorescently-labeled histology samples of tumor tissue. Using the iBox Explorer's high-specification, cooled camera and RFP filters, very crisp images of tumor cells at two different magnifications were obtained. These images clearly delineate cell and tissue borders and cellular morphology. The applications of the iBox Explorer Imaging Microscope can expand to include other aspects of cancer study, such as elucidating the nature of the tumor microenvironment, hematogenous trafficking of metastases, tumor angiogenesis and tumor shedding. With a resolution of 2.28 pixels per micron, the use of the iBox Explorer has the capability to image in vivo applications on the microscopic level.
iBox and VisionWorks are registered trademarks of UVP, LLC. Explorer and BioLite are trademarks of UVP, LLC.
For fourther information click here
Media Partners

